A geographic information system (GIS) map displays data in a visual format. It is essentially a database combined with spatial or geographic information.
A geographic information system (GIS) map displays data in a visual format. It is essentially a database combined with spatial or geographic information.
Plotting information on top of a map can reveal data relationships that would otherwise be difficult to see.
Features of GIS Maps
The type of data you are using determines the type of GIS map you are creating. Your map might have one or more of these features.
If you are mapping information about exact locations, then your map will have nodes (also called “points” or “dots”).
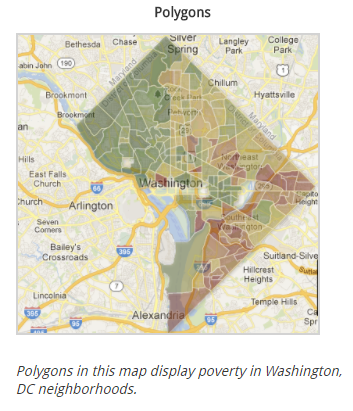
If you are mapping geographic areas—such as counties, census tracts, and zip codes—then your map will have polygons (also called “shapes”).
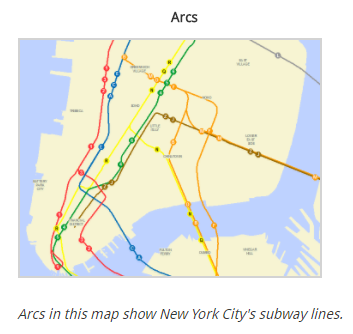
If you are mapping lines—such as highways, rivers, or subway routes—then your map will have arcs (also called “lines”).
How to Make a GIS Map
The exact steps you need to follow to create a GIS map depend on the application you are using. However, the basic steps below form the foundation of all GIS maps.
Step one: Start with data about locations
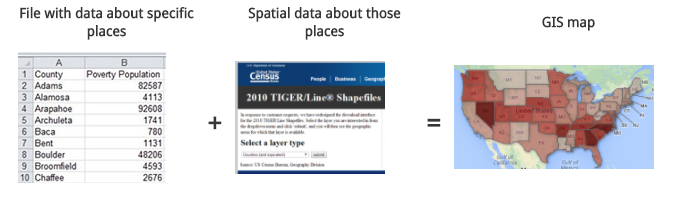
A GIS map starts with a spreadsheet of data about geographic locations. The locations might be a specific place (like a street address), a geographic area (like a county or zip code), or a line (like a stretch of highway or a river).
Step two: Organize your data
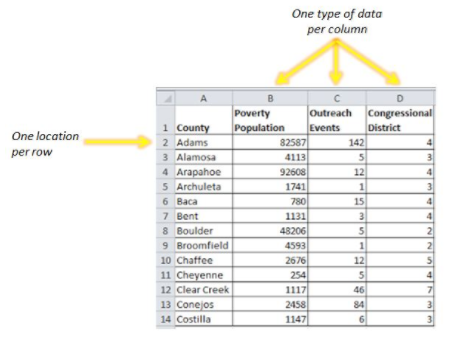
Spreadsheets are organized into columns and rows. For GIS mapping, the rows should be locations, and the columns should be information about the locations.
For example, if you were mapping information about counties, each row in your spreadsheet should be a specific county. The columns would be pieces of information about the counties, such as the poverty population, the number of outreach events conducted in the county, or the congressional district.
Step three: Match your data to geographic locations
Most web-based software will recognize street addresses on your spreadsheet and automatically geocode them (plot them on a map). Some software can even recognize political geographies such as counties and automatically map those for you, too.
If your software doesn’t automatically map your geographies, you will need to find and download a separate file that gives the software spatial information about your geographies, such as the latitude/longitude of your addresses, or the location, size, and shape of the political geographies.
Once you match your data to specific geographies, you have a GIS map.
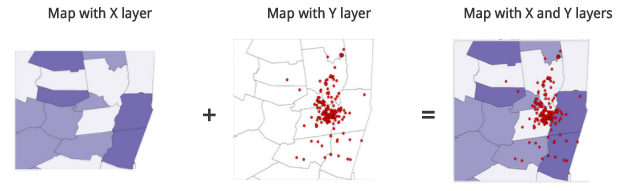
Step four: Add additional data in layers
When you add new data to your map, that data appear as a layer. By layering different data sets over each other, you can begin to see additional relationships.
Step five: Customize and share
Once your data is mapped, take some time to customize it so that your data tell a clear story.
Most maps have a number of styling options:
- The basemap: Some software allows users to choose different types of maps as their “base,” and then layers data on top of that.
- Color choices: Polygons in GIS maps depend on color differences. Make sure color differences are clear but complementary. If you need a little extra help, the website, Color Brewer, provides color schemes for maps.
- Labels: If you’re using labels, double check to make sure your software is pulling from the right column.
- Legends: If your map has symbols or color coding, there should be a legend that explains any visual component to the audience.
- Info windows: Adjust the information that displays in interactive “info windows” to make sure you are providing your audience with relevant information.
- Layers: In a complex map, you might have 10 layers of data. However, it probably is not helpful to look at all of those layers at once. Make sure you are only displaying information that is immediately useful to your audience.
Once you’re satisfied with how the map looks, you can share your project by printing it or embedding it online.